Wrapping up a field season of snow reflectometry - and getting ready for the next
Last winter, I did not just build and try out a new measurement technique for measuring the optical properties of snow, I also took it out a couple times too see how the snow in Oregon behaves. While the results aren’t conclusive yet, I’m convinced that we can for the first time observe grain size feedback from impurity radiative forcing!
Effective particulate concentrations
Last winter, I measured snow properties in 24 locations in the Oregon Cascades. Mostly, the snow behaves predictable. Grains are small when the snow falls, and grow larger over the next couple days. The snow is relatively clean when fresh and gets dirtier over time. It is light and fluffy at first and snowly gets denser and stickier.
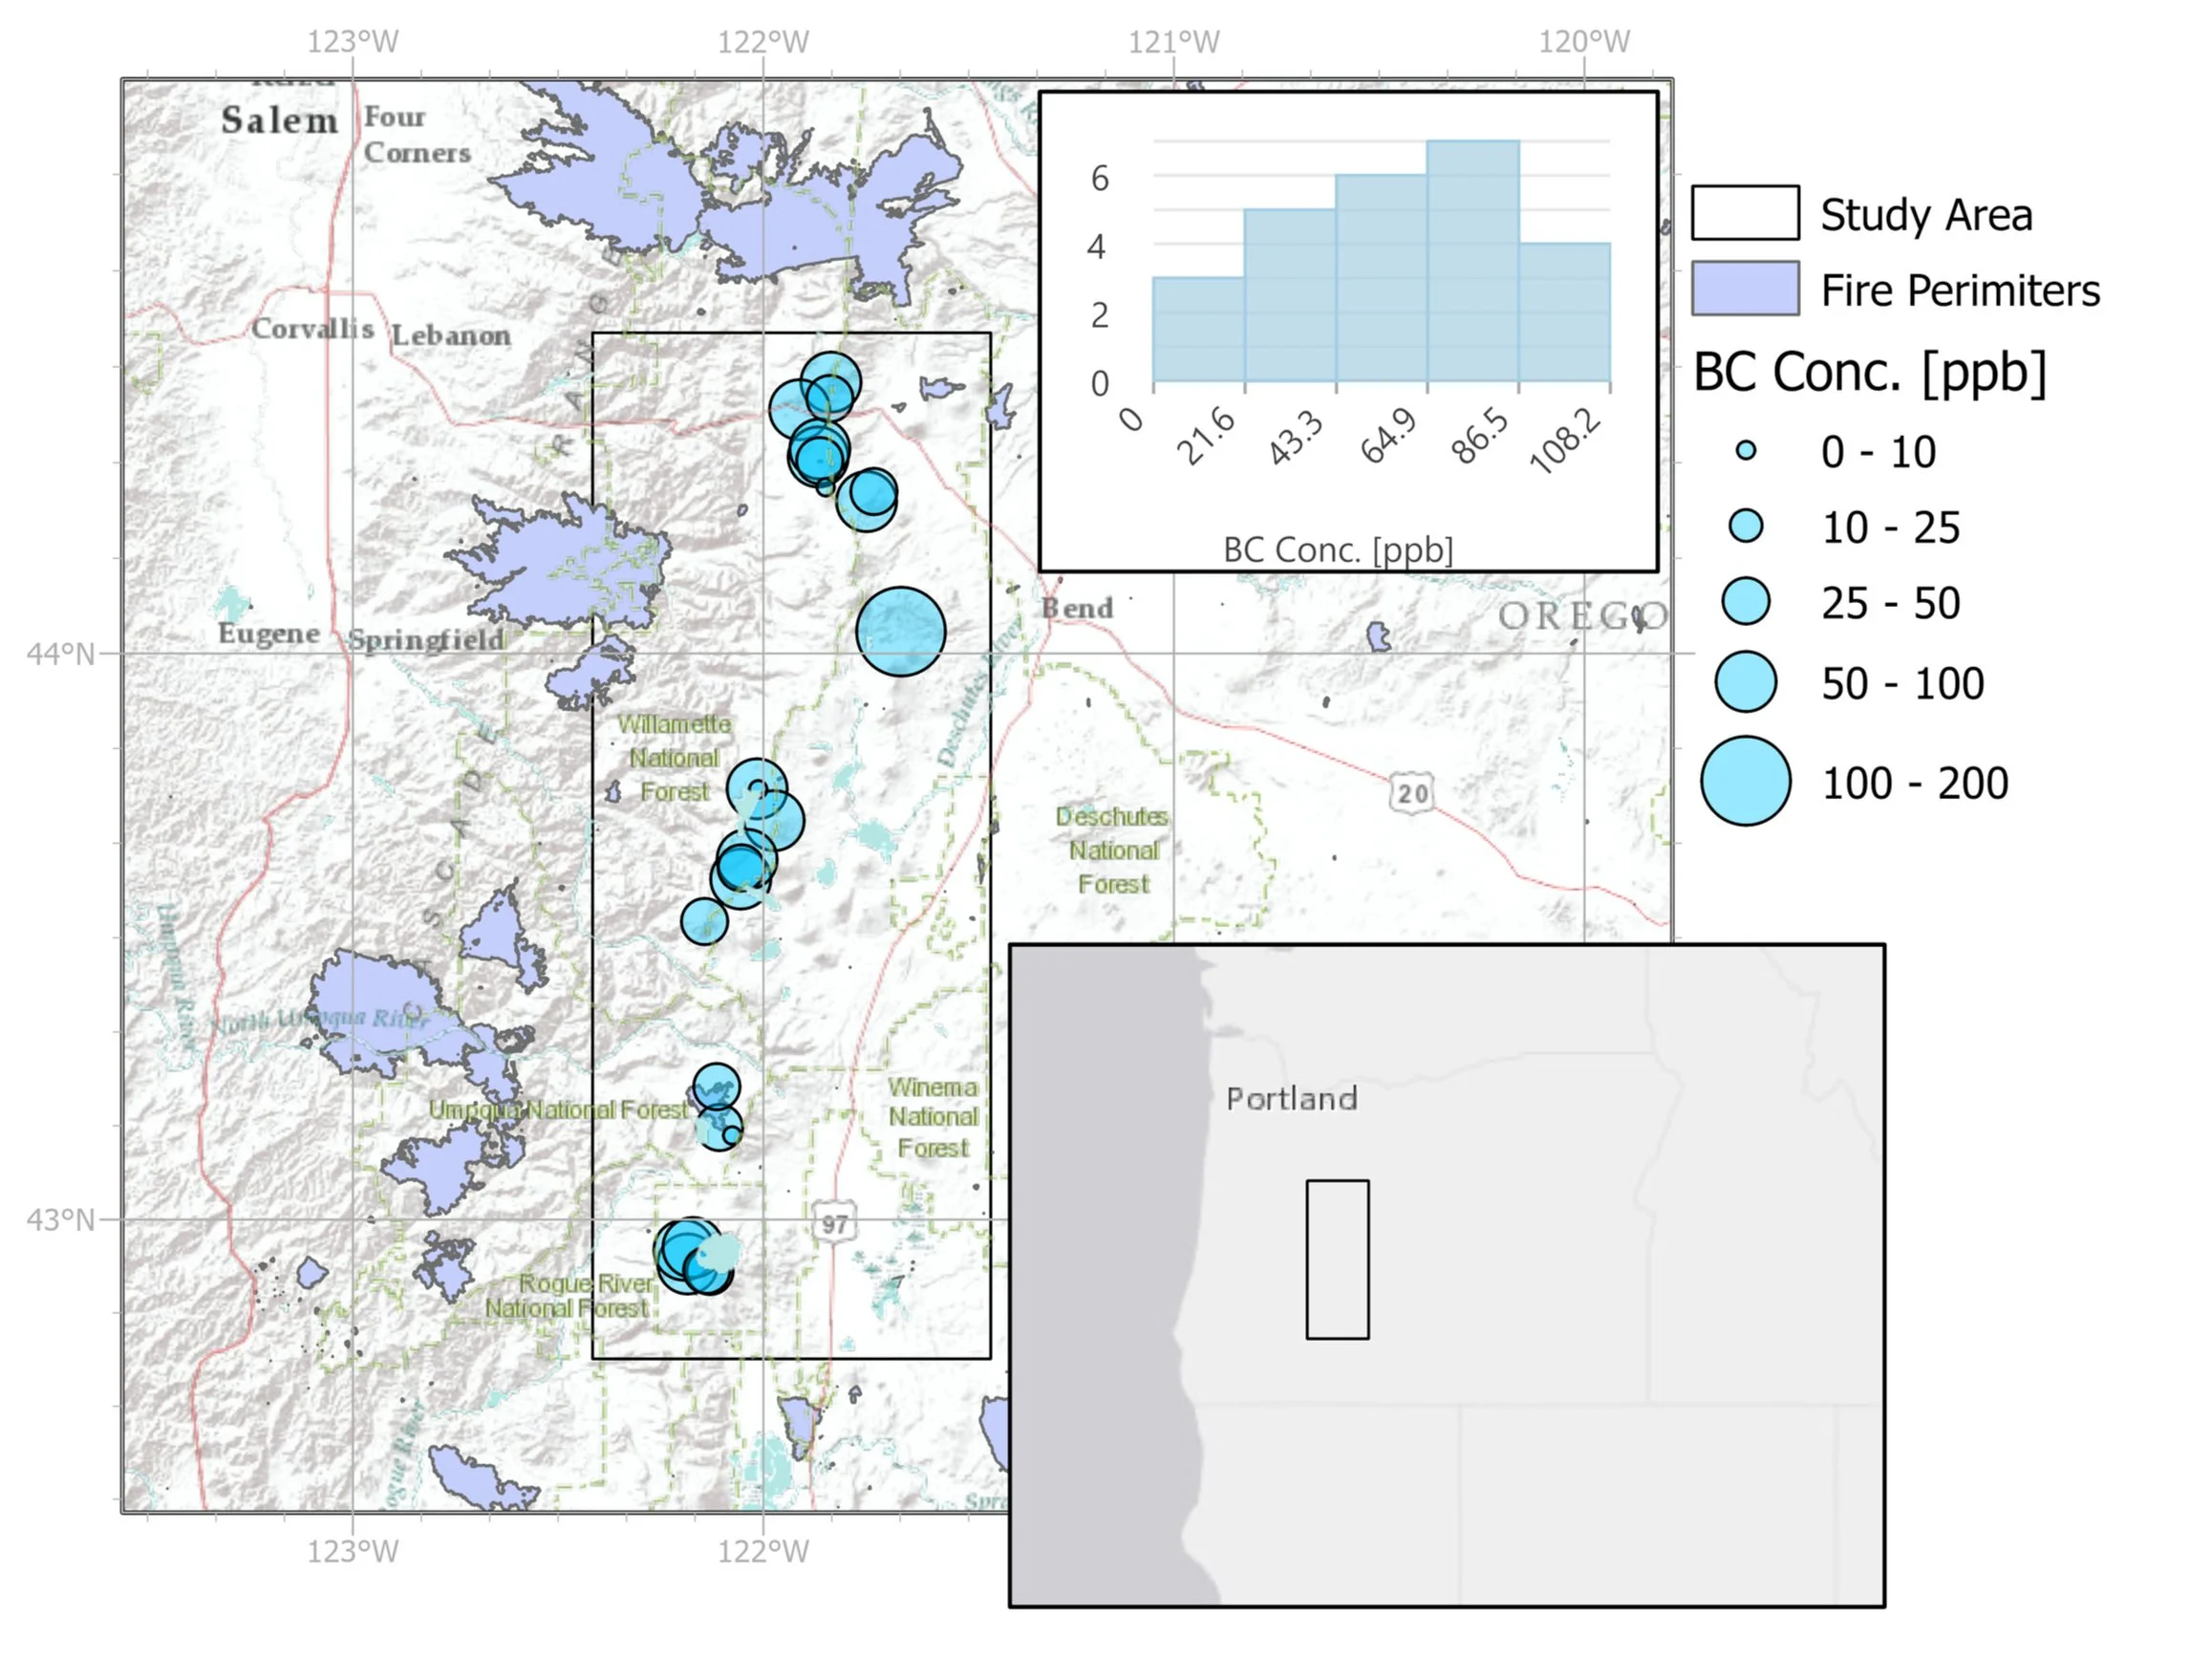
The absorption coefficient then describes how much light the individual grains, which are made up from ice, absorb. Subtract the absorptivity of clean ice, and you get the component that is caused by particulates (“dirt”) in the snow. The map shows this component converted to the concentration of black carbon, i.e., soot. Tat means, if the particulates ere all made up from soot (which they aren’t, but I also don’t have a way of finding out what it is exactly), this would be the concentration in the snow.
Looking at this map, where the size of the blue circles represents the soot concentration or how dirty the snow is, there doesn’t seem to be much of a pattern. Clean areas next to dirty ones, and those mixed together throughout the entire mountain range. Things get interesting, when we look into each data point’s history: Many of these data points were taken in areas that have recently (in the last 10 years) been burned. Areas like the Bybee Creek fire in Crater Lake National Park, the 2020 Thielsen Fire, or the 2018 fire on Potato Hill. Other location have not been burned.
When we only look at those points where I took measurements in the first three days after it had snowed (which is most of them - this allows me to weed out some outliers from the snow drought in January or late season), a pattern emerges:
Grain size feedback
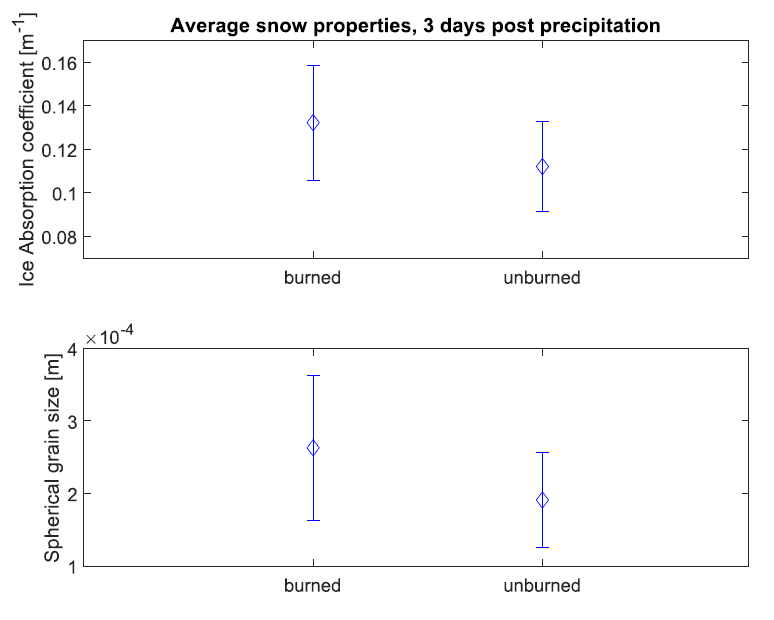
The top plot compares the average ice absorption coefficient in burned and unburned areas. A larger value means that the snow is dirtier. No surprise, the higher values are in the burned areas. The bottom plot, however, shows snow grain size: And again, the higher values are found in burned areas!
Finding dirtier snow in burned forests is not surprising, and this has been studied, for example by Prof. Gleason at Portland State University (for example: https://doi.org/10.1002/grl.50896). The larger grain size is not directly the result of the wildfire debris contaminating the snow, but and indirect one. Prof. McKenzie Skiles at the University of Utah has theorized that when the increased concentration of light-absorbing impurities leads to higher absorption (this is called radiative forcing), the snow metamorphosis is sped up, meaning faster grain growth. Skiles modeled this by combining physical models for now albedo and snow structure (https://doi.org/10.1029/2018WR024573), which is now being developed for physical snow melt modeling .
These data might be one of the first observations of this effect in the field! And while not statistically overwhelming, I hope to get more specific data this winter and show a detailed time series of the effect.